Connected Environment
Wireless sensor networks to monitor the health of soil, waterways, the atmosphere and wildlife.
Nature and technology are often portrayed as opposites, but the Internet of Things is bringing them together in a new kind of harmony. Networks of small, wireless sensors can be deployed in any ecosystem — oceans, forests, wetlands — while cloud-based data platforms connect researchers, conservationists and regulators to real-time data about the health of the environment. These systems not only increase our understanding of the ecology, but help protect plants, wildlife and humans, too.
This Channel Guide will help you:
- Learn about different kinds of environmental sensors and their application.
- Discover projects that are using IoT technologies to study and monitor ecosystems.
- Identify the best tools and products for creating your own environmental monitoring network.
11/01/2019
Wildlife and Habitat Monitoring
Led by ecologists in academia and government agencies, these projects are deploying sensor networks into a variety of environments. Fleets of low-cost sensors, some in the form of autonomous robots, offer an unprecedented level of detail about these ecosystems adfgdfnd help direct future research efforts.
Floating Sensor Network
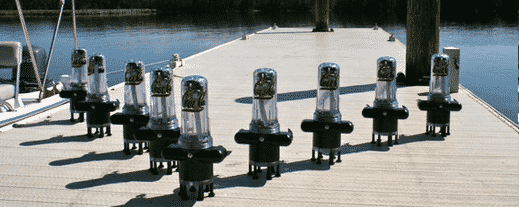
The Floating Sensor Network is a project by researchers at UC Berkeley that provides real-time, high-resolution data on waterways via a series of mobile sensing ‘drifters’ that are placed into the water and monitored by cell networks and short-range wireless radios.
As the drifters are carried by the water, their GPS receivers track their movement while other on-board sensors monitor temperature and salinity levels. This data can then be used to estimate river flow and contaminant propagation in real-time and eventually be combined with other sensor data streams (USGS permanently deployed sensing stations, mobile measurements, etc) to create “traffic maps” for an entire delta, showing the speed and depth of the water, and how contaminated the water is.
The long term vision of the project is to “put California water online, to create a system that will enable water managers and scientists to visualize the evolution of California’s water resources in real time.”
The Sacramento River is the first testing bed for the fleet of sensors that can also be deployed in response to unanticipated events like floods, contaminant spills and levee breaches.
The rapid deployment of such a fleet can lead to an immediate and more precise understanding of “where the water is going,” thus helping agencies to contain disasters more quickly and more efficiently. In addition to tracking contaminants, the technology can be deployed in a levee system to search for signs of levee leaks (abnormal temperatures, abnormal salt concentration) and it can be deploy around levee breach to confirm a repair is functioning properly.
Learn more about the project at http://float.berkeley.edu/ or watch the clip for more details:
Team: Principal Investigator: Alexandre Bayen – Lead Graduate Student: Andrew Tinka – Complete list
Image Credits: University of California Berkeley
Intelligent River: Wireless River Sensors
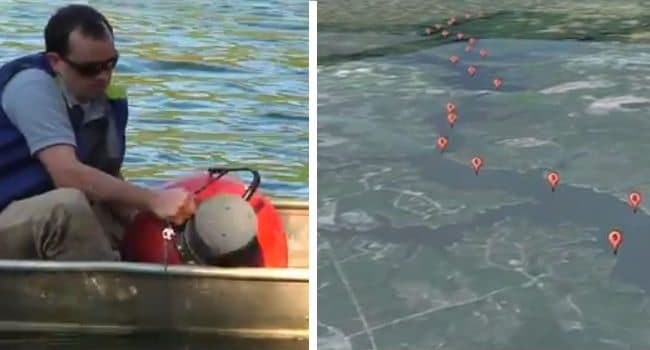
Intelligent River is the first stage of an environmental monitoring project that’s attempting to put the Savannah River Basin in the cloud. The project is run out of the Institute of Computational Ecology at Clemson University in South Carolina, and is based on a network of customized sensors built by the school’s Dependable Systems Research Group.
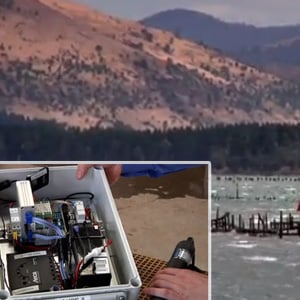
The sensor platform is called MoteStack, because each sensor, or mote, consists of a literal stack of components. One layer typically houses a small computer processor, and another houses the radio equipment that lets the mote connect over wireless or cellular networks. Like Lego bricks, other layers can be snapped on with sensors to measure rainfall, wind speeds, temperature, and the like. Each mote lives inside a weatherproof housing — a buoy, if it’s deployed on the river — and can run for months or years on battery power.
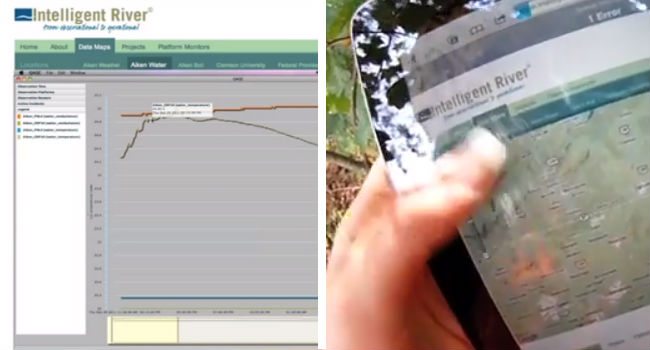
On the back end, the researchers have developed a suite of custom software tools, from the motes’ OS to mesh networking protocols that help the motes communicate through dense foliage and other terrain hazards. And they’re creating a web portal where real-time data will be available to researchers and the public.
One of the long-term goals of the project is to develop a low-cost, flexible system that could be deployed in a variety of environments to monitor any number of variables — everything from soil composition to highway traffic patterns — and to make that data available in real time to researchers, city managers, and government agencies.
“We hope to create the world’s first automated river,” Gene Eidson, director of the Institute for Computational Ecology, tells Postscapes. His team is already working on spin-off projects, such as Intelligent City, Intelligent Farm and Intelligent Forest, in communities along the Savannah River. By synthesizing those MoteStack networks with publicly available databases from state and federal agencies, Intelligent River will make it possible to build infrastructure that can respond immediately and automatically to changes in the environment.
The potential to revolutionize city planning and environmental management has the National Science Foundation, the Environmental Protection Agency, and the Army Corps of Engineers all interested in Intelligent River.
“I think it will absolutely transform the way our resources are monitored and managed,” Eidson says.
Deployment of the MoteStack network into the 312-mile Savannah River Basin is underway, with several dozen motes in the field currently and dozens more to be deployed in 2014 to towns, farms and waterways along the Savannah.
Watch the Institute for Computation Ecology’s website for project updates and real-time data, and check out the video for more details.
Geologic Monitoring
Grillo
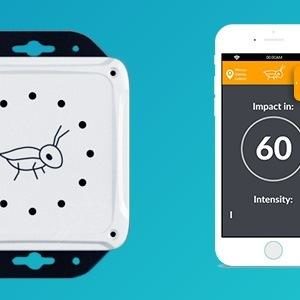
Seismic sensor networks are often the province of academia or government, but one Mexican startup is taking an entrepreneurial approach to providing early warning of earthquakes. Grillo (which means ‘cricket’ in Spanish) is taking advantage of low-cost accelerometers and wireless modules to build affordable consumer devices that can both extend the earthquake detection network and act as an in-home alarm system when a quake is on its way.
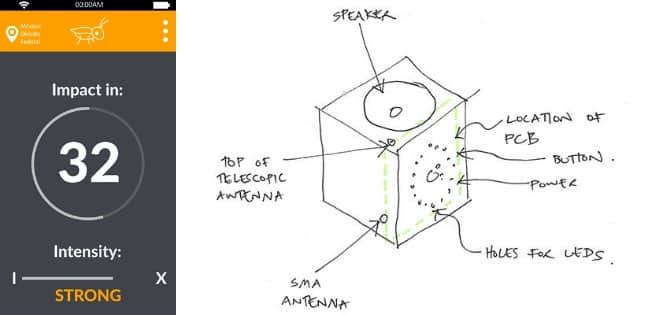
The Mexican government does have a seismograph network called SASMEX in place in the area surrounding Mexico City, which has unusual geology that makes it extremely vulnerable to earthquakes. When a quake is detected, emergency alerts are broadcast on radio and television, but the officialSARMEX devices that can receive a direct signal and sound the alarm often cost upwards of 18,000 pesos ($1,000).
Grillo’s boxy devices, by contrast, run closer to $50. Made with a custom circuit board design, they can receive the SASMEX signal, but also connect over Wi-Fi to Grillo’s cloud servers. Drawing on uploaded accelerometer data, Grillo can turn each device into a node in its own parallel seismic detector network — and can push its own alerts back to Grillo devices. A speaker and LED ring in each device provides a visual and auditory alarm that allows for precious seconds of preparation before a quake hits.
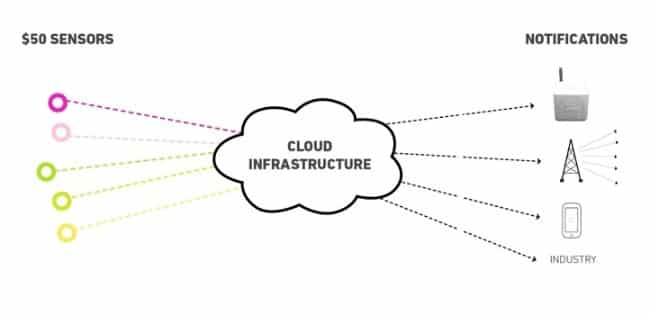
Because it’s not tied to seismograph stations in a specific geographic area, Grillo’s alert system has the potential to go international. And you don’t have to pay for a device to take advantage of the early warning network; the company is planning to offer free alerts, presumably via an app, to anyone who requests them (though factors like network coverage may man the message won’t reach you as quickly as it would with a dedicated device).
Grillo crowdfunded an initial run of its devices in Mexico, and is now working on an updated version for the global market that will take full advantage of the cloud. In October 2015 the company received a $150,000 grant from USAID’s Development Innovation Ventures program.
Learn more about Grillo in the video below.
Brinco: Earthquake Detection & Warning Network
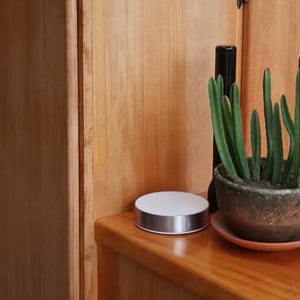
Just a few years ago, the idea of a “personal seismograph” would have seemed ridiculous — most of us aren’t geophysicists, after all, and what good is earthquake data to the average consumer? But as the Internet of Things has introduced us to a host of new, inexpensive sensors for collecting and sharing data about the physical world, it’s starting to seem plausible that an in-home earthquake detector could be just as fundamental as a fire alarm.
Seismographs traditionally are complex, delicate scientific instruments that can cost tens of thousands of dollars. But OSOP, which has made that kind of equipment for years, is now running an Indiegogo campaign for Brinco — a consumer-friendly device that leverages a custom-built motion sensor alongside the power of the IoT, to create a crowdsourced early warning network for earthquakes — and it costs less than $200.
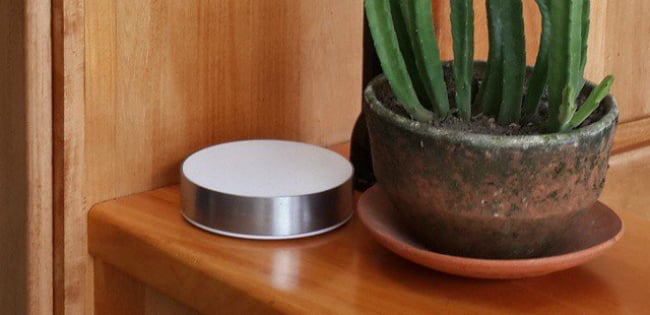
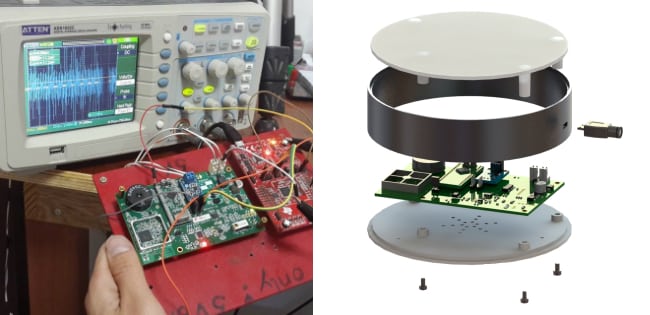
All a user needs is a flat surface, a power outlet, and a Wi-Fi network. Once configured, the device maintains a constant connection with the Brinco cloud servers, which collect anonymized seismography data from Brinco users as well as from government and academic sources. Because the seismic waves of an earthquake travel relatively slowly through the ground, the servers have a chance to detect that a quake has begun, calculate how far it will spread, and send near-instantaneous warnings to Brinco users in the affected areas.
While those nearest the epicenter of a particular quake will still be caught unawares, Brinco users farther away will see flashing lights and hear a spoken warning about what to expect and when the quake will reach them. For earthquakes, even a few seconds of warning can allow someone to seek safety. In the case of a tsunami — the sudden rise in sea level that follows an undersea quake — the warning can come hours ahead of time.
Brinco represents the best of what the IoT can be: A solution to a very real and age-old problem, made possible by the combination of inexpensive electronics and the global telecommunications network. With the devastation of recent quakes and tsunamis still fresh in our collective memory, the value of a robust, reliable early warning system is undeniable. Now that the technology is cheap enough to create a distributed network of seismograph-alarms, it may actually be feasible for municipalities in earthquake-prone regions to start requiring systems like Brinco in their building codes.
Brinco’s Indiegogo campaign runs through August 22, and the device is expected to ship in July 2016. Recognizing that those who would most benefit from an early warning system aren’t always those who can afford one, several of the reward tiers allow backers to provide Brincos to schools or individuals in earthquake zones around the world.
Learn more in the video below.
Products and Tools
Led by ecologists in academia and government agencies, these projects are deploying sensor networks into a variety of environments. Fleets of low-cost sensors, some in the form of autonomous robots, offer an unprecedented level of detail about these ecosystems adfgdfnd help direct future research efforts.
Weather
Some of the most basic sensors in IoT products collect weather data, like temperature and humidity. Many research projects and even some commercial companies are using these sensors, and more sophisticated weather monitoring equipment, to collect highly localized data and improve forecasting.
AvaTech SP1: Smart Avalanche Probe
Here in Colorado, we know that exploring the snow-covered backcountry of the mountains can be a beautiful and exciting experience. We also know that it can be dangerous, not least because of the risk of avalanche. AvaTech, a startup with one foot on the MIT campus and the other firmly in “snow country” (Park City, Utah), is bringing the power of the Internet of Things to bear on avalanche prediction.
One risk factor of avalanches is when a layer of dense, heavy snow sits on top of lighter layers. Any disturbance, such as the weight of a backcountry skier, can set that top layer in motion. Snow safety professionals, like Forest Service rangers and safety crews at ski resorts, do their best to keep tabs on the state of the snowpack and to predict where avalanches are likely — but traditional methods involvedigging a snow pit and making manual, subjective assessments of the layers of snow.
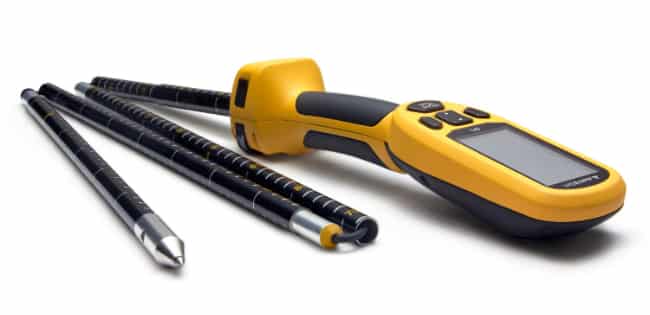
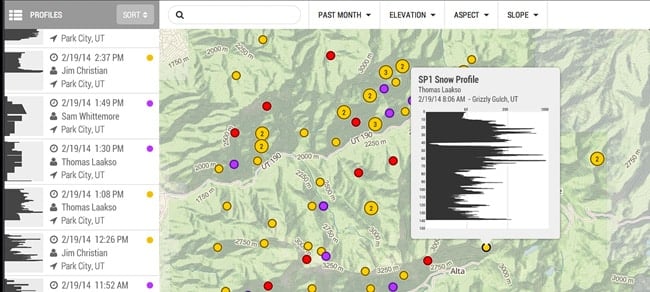
AvaTech’s SP1 is a pressure-sensing electronic probe that eliminates all of that laborious and time-consuming work. Users simply push the extendable pole into the snow at the spots they’de like to test. The device records the force being exerted to push it through the snowpack at a rate of more than 5,000 measurements per second. The data appears almost instantaneously on a small LCD screen set into the handle, showing a detailed graph of how the density of the snow changed as the probe went deeper. The SP1 is powered by two AA batteries, which can last for weeks while the device sleeps, folded compactly inside a backpack, between tests.
Because the probe only takes a few seconds to use, snow safety pros can do a lot more testing than with manual methods and build up a much more complete picture of the state of the snow. Even better, the SP1’s GPS-tagged data can be synced to a mobile device over Bluetooth and uploaded to AvaNet, where it is shared on a global, collaborative map of snowpack conditions based on uploads from other SP1 users as well as data entered from manual testing.
The SP1 is not a consumer device and isn’t meant for recreational mountaineers. But university researchers, avalanche safety organizations, and ski resorts can preorder it — and many already have, especially in the U.S. mountain west. The Forest Service’s National Avalanche Center is even promoting AvaTech’s technology as an emerging standard for avalanche safety.
Learn more in the video.
Case Studies
A deeper dive into some projects using sensors and connectivity for environmental applications
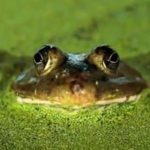
Remote Audio Habitat Monitoring: ARBIMON
ARBIMON (Automated Remote Biodiversity Monitoring Network) is a project developed out of the University of Puerto Rico by Carlos Corrada-Bravo, Mitchell Aide and their team that uses off-the-shelf technology in combination with advanced machine-learning algorithms to help analyze an area’s biodiversity.
Traditionally, biodiversity is assessed using a variety of methods that are generally costly, limited in space and time, and most importantly, they rarely include a permanent record…..Long-term information is needed to understand the implications of land and climate change on biological systems. From both a conceptual and management perspective there is an urgent challenge to increase biological data collection over large areas and through time. – Full Article
At the core of the project are field monitoring stations that are created using solar panels, a 2nd generation iPod, 12v car battery, 900 MHz Radio/antenna, and a 20Hz-20kHZ microphone all wrapped up tightly in a waterproof case. The field systems capture one minute long recordings of an area every 10 minutes and then passes that data along to a base station (that can be located up to 40 kilometers away) to eventually reach the main projects server for analysis and backup.
Once captured and stored the audio is processed against an automated species identification system and algorithms that has been trained by researchers based on specific vocalization of a species.
The ARBIMON team has created and tested species-specific models for a range of amphibians, birds, mammals, and insects. Once created these models can be can be used to process previously recorded audio to generate daily and monthly patterns for a specific species or a “soundscape index” for an entire area that can be tracked over time.
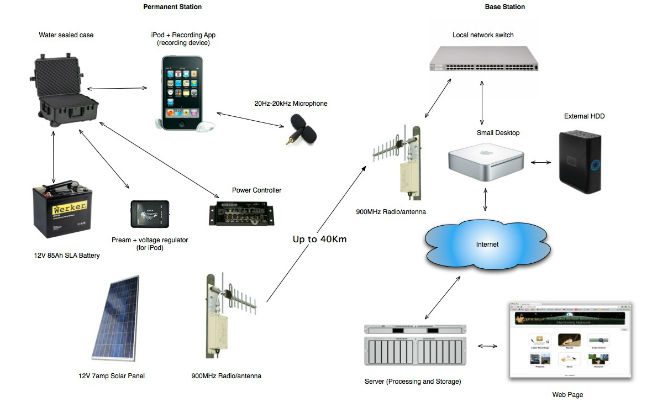

You can check out a more detailed overview of the ARBIMON system at Arbimon.com/arbimon/ or read their latest research findings on the project at PeerJ.
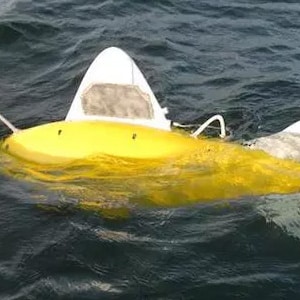
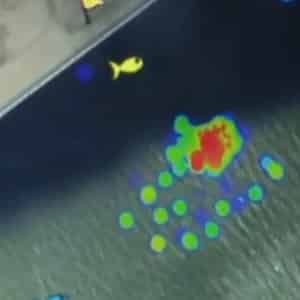
SHOAL: Pollution monitoring fish
The Shoal project is a European 7th framework research initiative led by professor Huosheng Huand his team at the university of essex creating a new type of real-time harbour pollution monitoring system via robotic fish.
The fish are currently being field tested in the port of Gijon, Spain
where water quality monitoring is now dependent on human divers and laboratory testing that only occurs around once per month (and costs up to €100,000 per year to maintain).
“By having autonomously controlled fish with chemical sensors attached we aim to do these tests in-situ. Further the fish will also be given an intelligence so that if they do find significant amounts of pollution and they deduce it’s coming from a source they will all work together to find the source of the pollution so that the port can stop the problem early before more pollution occurs.”
Outfitted with a sonar system for communication and a host of electrochemical sensors measuring heavy metals and water quality (Dissolved O2, Conductivity, ORP) levels the fish use their built-in swarm intelligence system to quickly narrow down the location and extent of the pollution source and send the information back to port authorities to take proper action. An infrared, GPS, and other sensor data also help the fish to measure their position, heading, speed etc and ensure that the fish are not stolen or damaged.
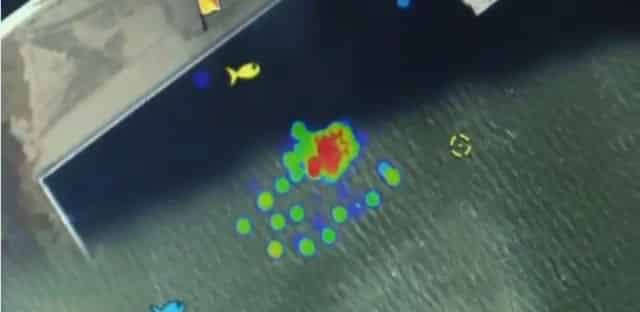
Although still in development mode the project coordinators would eventually like to commercialize the project and sell these systems to ports throughout the EU and the world.
Smart Shark Monitoring System
In our post about Wolfram Connected Devices and Thingful the other day we, speculated about whether the average person could find a use for data about the precise location of a shark (aside from marine biology research, of course). Well, it turns out the Department of Fisheries of Western Australia beat us to the punch: they put the sharks on Twitter.
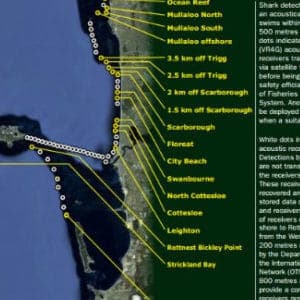
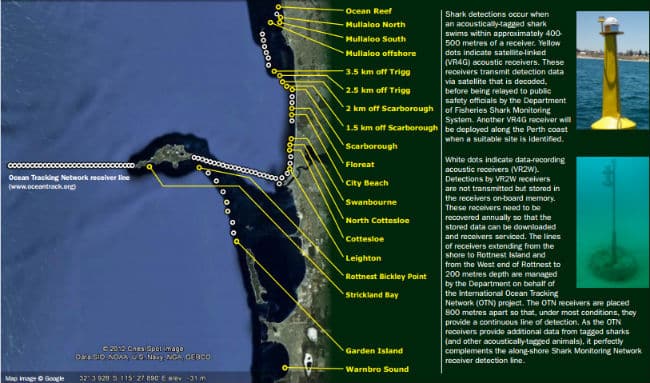
The department’s shark monitoring network uses long-lasting acoustic tags to keep track of sharks. As the name implies, the tags use sound to broadcast the shark’s location in the water. A network of listening stations along the coastline sends updates by satellite connection whenever a shark comes near. That triggers an automatic tweet from Surf Life Saving Western Australia, a non-profit group that also tweets about shark sightings from helicopter patrols, calls to the Water Police tipline, and other sources.
More than 300 sharks have been tagged, and there are several dozen satellite-linked listening stations installed so far from Perth down to the southern coast. In addition to warning surfers and beach-goers, the network is gathering valuable data about the size and movement of shark populations.
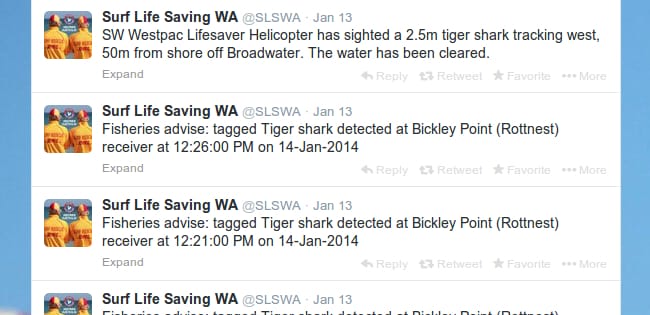
The majority of the more than 160 shark species native to Australia pose little risk to humans. Common species like hammerheads generally bite only when threatened, and their bites are rarely fatal. Only three species are significantly dangerous: bull sharks; great whites; and tiger sharks, like the one(s) that tweeted from listening stations near Perth almost every day last week.
Tags and tweets are not a perfect system, however. The listening stations have a limited range, and there are untold thousands of sharks of all species that haven’t been tagged. So the fact that there hasn’t been a tweet doesn’t mean the beach is safe. On the other hand, the presence of a shark — even a tiger, bull or great white — doesn’t mean an attack is imminent. Shark attacks, while terrifying, are still very rare. WA Todayrecorded only a handful of attacks in Western Australia last year.
But to minimize that risk even further, Surf Life Saving has plenty of safety tips. The next time you’re at one of Western Australia’s beaches, keep them in mind — and keep an eye on your Twitter feed.
Oyster Sensor Network
The SenseT (Sensing Tasmania) project is a collaboration between the Tasmanian and Australian government, local universities (UTAS and University of Melbourne’s Institute for a Broadband-Enabled Society), and businesses including IBM to deploy networks of environmental sensors across the entire state of Tasmania. Connected via a new broadband network the $42 million project combines historical, and real-time sensor data and makes this information available for public usa via API’s and an app-store.
One of the latest projects from SenseT is OysTag, a Aquaculture Biosensors project that aims to help optimize the health and production of oysters in the region.
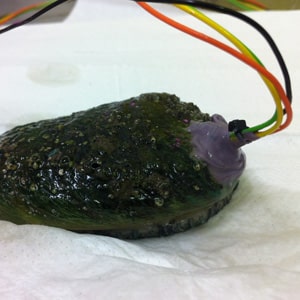
Large sensor devices are deployed in the farms to measure general environmental conditions like temperature, and salinity levels of the water. Small Biotags are also being attached to individual oysters to detect the current depth of the creature, its movement, how much ambient light it is receiving and even the heart rate of the animal.
This data can be aggregated and used to predict the growth rate, feeding behavior and details on how to optimize conditions for healthier animals and deliver safer and more productive crops for individual farms and across the industry as a whole.
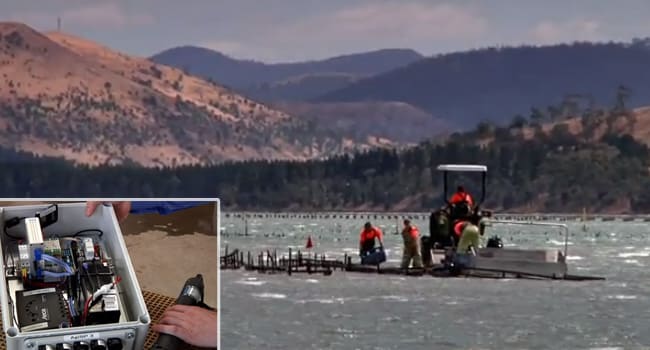
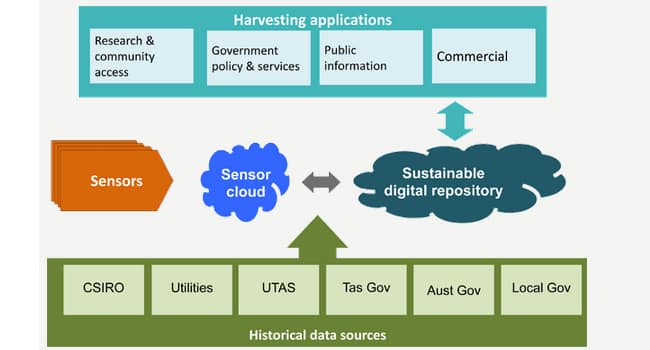
More details about the project can be found at: Sense-t.org.au or by watching the video below created by CSIRO (Commonwealth Scientific and Industrial Research Organisation).
TOPP: Remote Wildlife Tracking
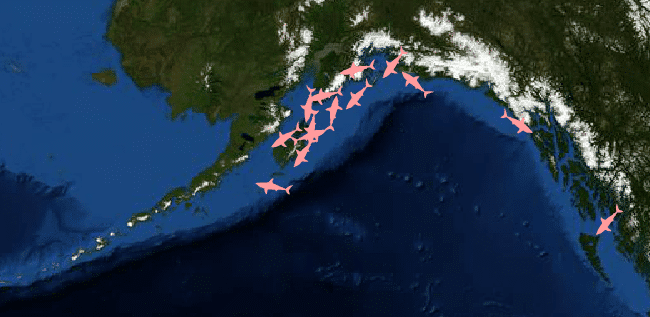
The TOPP (Tagging of Pacific Predators) project began in 2000 as part of a 10-year, 80-nation “Census of Marine Life” research study to help better understand and protect how life is actually operating in the world’s oceans.
The program is currently managed by NOAA’s Pacific Fisheries Ecosystems Lab, Stanford’s Hopkins Marine Lab, and the UC Santa Cruz Long Marine Laboratory and has tagged more than 4,000 individual animals across 23 species of predators that inhabit the Pacific Ocean with biologging sensors and tracking technologies.
The TOPP project uses several types of tags in their research studies:
- Archival tags
– These tags can last up to 10 years and are surgically implanted. The tags can record pressure (for depth), ambient light (to estimate location), speed of travel and internal/external body temperatures. - Pop-up archival tags (PAT)
– These temporary tags have a battery life of around two weeks and can be released from an animal at a pre-set time (30, 60, or 90 days). They are used mainly on animals that don’t spend much time on the water’s surface and are able to collect data on pressure, ambient light and internal and external body temperatures. - Smart Position or Temperature Transmitting Tag (SPOT)
– Designed for animals living near the surface this tag can last up to two years and is designed to transmit its sensor data after the antenna of the device breaks the surface of the water. The data includes speed, pressure, water temperature and location data calculated by Doppler shifts in the transmission signal over time. - Satellite Relay Data Logger (SRDL)
– These tags compress data for more efficient transmission to the Argos satellite. They can be combined with CTD tags to record temperature, depth & salinity profiles.
Once attached to the animals the tags send their location and sensor data to the Argos satellite (which is dedicated only to monitoring data focused on environmental research and protection) orbiting 850 km above the earth for the scientists to access. TOPP researchers then combine this information with other sea surface temperature maps and current chlorophyll location models to help them study specific species migration patterns, better manage fisheries, and help define management policies to protect the animals from being caught in nets or other industry activities.
Engineering has provided the biologging community with ever more sophisticated tags, and advances in the application of statistical methods to interpret these data have yielded powerful new tools for understanding animal behavior. The technology has also reached sufficient sophistication and reliability such that the data collected is often equivalent to industry standards for environmental sampling, which has led to profound advancements in the marine realm, where the sheer vastness, in 3 dimensions, limits our ability to observe. Biologging data is now being increasingly applied to marine management and conservation policy.

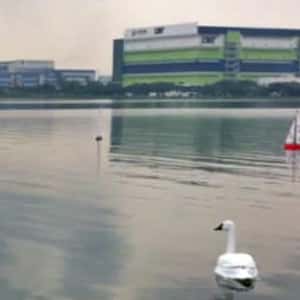
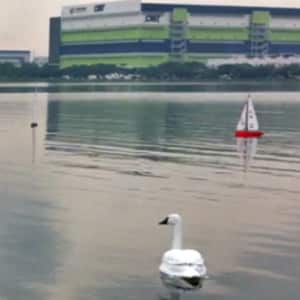
NUSwan: Robotic Water Sensors
The TOPP (Tagging of Pacific Predators) project began in 2000 as part of a 10-year, 80-nation “Census of Marine Life” research study to help better understand and protect how life is actually operating in the world’s oceans.
The program is currently managed by NOAA’s Pacific Fisheries Ecosystems Lab, Stanford’s Hopkins Marine Lab, and the UC Santa Cruz Long Marine Laboratory and has tagged more than 4,000 individual animals across 23 species of predators that inhabit the Pacific Ocean with biologging sensors and tracking technologies.
The TOPP project uses several types of tags in their research studies:
- Archival tags
– These tags can last up to 10 years and are surgically implanted. The tags can record pressure (for depth), ambient light (to estimate location), speed of travel and internal/external body temperatures. - Pop-up archival tags (PAT)
– These temporary tags have a battery life of around two weeks and can be released from an animal at a pre-set time (30, 60, or 90 days). They are used mainly on animals that don’t spend much time on the water’s surface and are able to collect data on pressure, ambient light and internal and external body temperatures. - Smart Position or Temperature Transmitting Tag (SPOT)
– Designed for animals living near the surface this tag can last up to two years and is designed to transmit its sensor data after the antenna of the device breaks the surface of the water. The data includes speed, pressure, water temperature and location data calculated by Doppler shifts in the transmission signal over time. - Satellite Relay Data Logger (SRDL)
– These tags compress data for more efficient transmission to the Argos satellite. They can be combined with CTD tags to record temperature, depth & salinity profiles.
Once attached to the animals the tags send their location and sensor data to the Argos satellite (which is dedicated only to monitoring data focused on environmental research and protection) orbiting 850 km above the earth for the scientists to access. TOPP researchers then combine this information with other sea surface temperature maps and current chlorophyll location models to help them study specific species migration patterns, better manage fisheries, and help define management policies to protect the animals from being caught in nets or other industry activities.
Engineering has provided the biologging community with ever more sophisticated tags, and advances in the application of statistical methods to interpret these data have yielded powerful new tools for understanding animal behavior. The technology has also reached sufficient sophistication and reliability such that the data collected is often equivalent to industry standards for environmental sampling, which has led to profound advancements in the marine realm, where the sheer vastness, in 3 dimensions, limits our ability to observe. Biologging data is now being increasingly applied to marine management and conservation policy.


Crowdsourced Air Quality Data
The Internet of Things has given a real boost to “citizen science” by putting low-cost sensors and computer chips in the hands of creative tinkerers everywhere. Take, for example, the latest project from Romanian maker Radu Motisan: a handheld air quality monitor that scans for pollution and radioactivity.
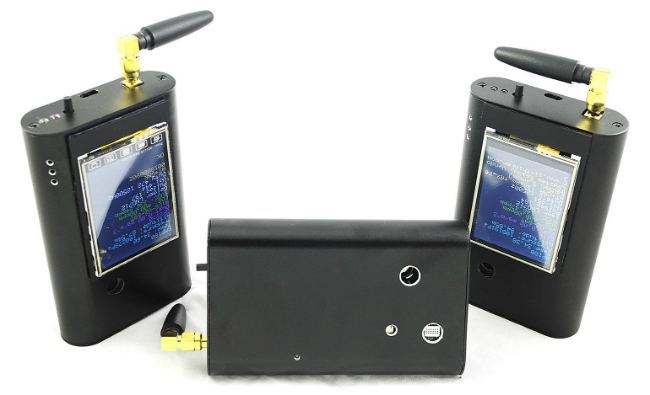
The Portable Environmental Monitor is Motisan’s entry for the 2015 Hackaday Prize, which answers the challenge to “Build something that matters.” Having previously created uRADMonitor, a radiation-detecting device and global reporting network that was a Hackaday semifinalist last year, it was a natural evolution to build on the worldwide infrastructure and offer a more flexible way to monitor health risks in our environment.
Stuffed into the prototype’s aluminum enclosure are an ATmega128 microcontroller, rechargeable battery, 2.4-inch LCD touchscreen, ESP8266 Wi-Fi module, and a suite of sensors — which can detect temperature and pressure, dust, carbon dioxide, volatile organic compounds, and three kinds of harmful radiation (alpha, beta and gamma). The device is controlled through a custom interface, the code for which is available as open-source software.
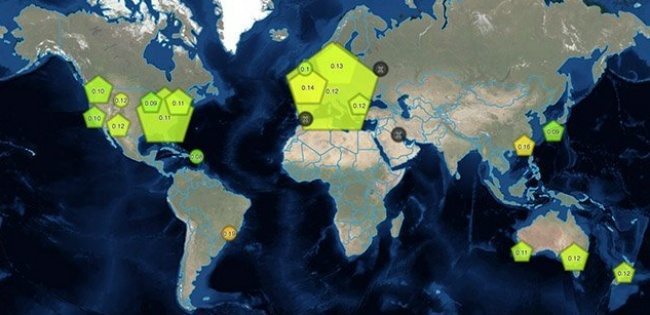
Data from each Portable Environmental Monitor unit is streamed to a server where it can be mapped and combined with data from the uRADMonitor network, allowing citizen scientists around the world to collaborate on a vast, crowdsourced dataset of global air quality and radiation measurements.
Check out the video below to learn more and see how the prototype works.
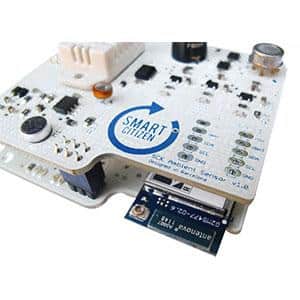
Related: AirBeam, Breathe, NUSwan, Oxford Flood Network, Smart Citizen Kit, Tzoa
Citizen Flood Detection Network
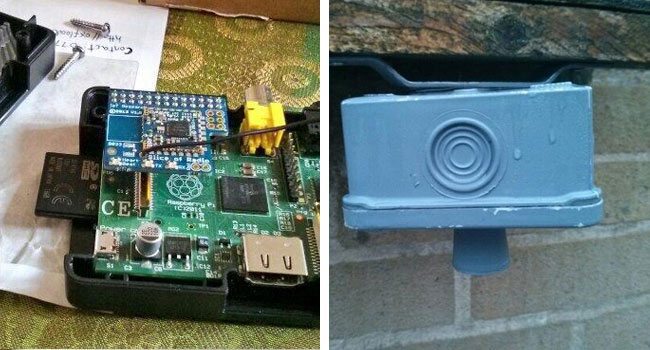
The Oxford Flood Network is a citizen science project to keep tabs on flooding in local waterways. It’s an example of how the Internet of Things can enable a community to be more connected to its environment (Which is especially relevant in this area after the destructive season of flooding that hasplagued much of the UK since the end of 2013).
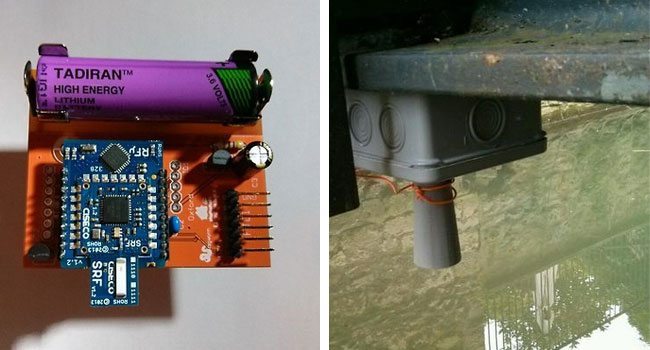
Ben Ward, founder of UK startup Love Hz, is the brains behind the project. His company specializes in wireless sensor networks, and is leading development of the low-cost, open-source equipment andsoftware that will monitor water levels in the Oxford floodplain.
The idea is to design sensors that are cheap and easy for citizens to build and install; the data will be published openly so anyone can use it to improve emergency alerts and gain a better understanding of the ecosystem. All of this comes on the heels of some of the worst flooding the UK has seen in years with two severe warnings still in place.
Each sensor is designed to live under a bridge or overhang above the water. An ultrasonic rangefinder sends out “pings” — like a bat’s echolocation — to determine the water level at five-minute intervals. The latest version runs on a small battery and includes a temperature sensor that helps account for the speed of sound varying with air temperature, which could otherwise throw off readings by several centimeters.
The network that allows these sensors to communicate relies on an experiment run by the UK’s telecom regulator, which opens small bands of spectrum between television channels. Appropriately enough, these gaps are referred to as “TV whitespace” or TVWS, and they’re great for widely distributed, ad-hoc communications like the Oxford Flood Network.
Thus far, Ward has focused on creating a functional prototype sensor, and is working on creating some visualizations based on the data it’s collecting — so there isn’t a full network per se in place just yet. But monitoring waterways near Oxford is only part of the goal. The project is also meant to serve as a proof-of-concept and a reference for other communities to do their own crowdsourced environmental monitoring.
According to Ward, the Oxford Flood Network “forms the basis of a blueprint for communities to build their own sensor networks to highlight their own issues – air quality, radiation, noise, whatever they can find a sensor for.”
Learn more at OxFloodNet.co.uk, or jump into the discussion by joining the project’s email list.
